What is SAHA Pension and Mutual Fund Ratings?
SAHA Pension and Mutual Fund Ratings are a composite measurement and ranking of returns and risks easily and conveniently. This ranking is based solely on quantitative (numerical) data and does not include any subjective evaluation. The ratings do not reflect SAHA’s opinion on the future performance of the funds and only assess and rank the fund’s past performance compared to its peers.How are the funds rated?
At the end of each month, Pension and Mutual Funds are compared with their peers in their respective categories and evaluated based on return and risk. Every investment involves risk. It doesn’t have to be, but generally, risk and return go up and down together. Therefore, evaluating Pension and Mutual funds solely based on their returns means ignoring the risk element. A fund with good returns may carry high risk or low risk. The SAHA Pension and Mutual Fund ratings aim to highlight funds that offer good returns with reasonable risk levels by penalizing high risk while placing a premium on high returns. Would a soccer team prefer a goal scorer who scores in every game he plays (100% return) but may only play 10 games a year due to frequent injuries, or a goal scorer who plays 50 games and scores 20 goals (40% return)? Investors have to take the same risks into account. When choosing between an ever-increasing number of funds, the performance expressed in returns should be adjusted for the risk carried. This is what the SAHA rating is for. The rating and star allocation of Pension and Mutual Funds are made “every month” on a MONTHLY, YEARLY, and 3-YEARLY basis. The reason for rating for 3 different periods is to prevent short-term cyclical developments from overshadowing the medium and long-term performance of the fund and to provide investors with a longer-term perspective. Only those Pension and Mutual Funds that have been in operation for at least 1 year from the date of initial public offering are rated. Fund rating methodology is based on 5 parameters:1. Performance (Return Measurement):
Measures the monthly (yearly and 3-year) % return of fund unit prices. Monthly measurements compare the fund unit price (NAV) on the last business day of the month to the last business day of the previous month; yearly measurements compare the fund unit price on the last business day of the month to the last business day of the month 1 year ago; 3-year measurements compare the fund unit price on the last business day of the month to the fund unit price on the last business day of the month 3 years ago. This parameter measures short (monthly), medium (yearly), and long (3-year) term returns depending on cyclical factors.2. Volatility (Risk Measurement):
This is based on the volatility of the fund’s monthly returns. Funds with more volatile returns are funds that carry more risk. The volatility of a fund’s return is measured by its standard deviation. The standard deviation measures the distance of a fund’s monthly return from its average return. In other words, a fund that returns 10% one month and loses 9% the next is riskier than a fund that gains 2% one month and loses 1% the next. Although both are up 1% after two months, the first fund carries much more risk for the investor. Typically, the volatility of the returns of equity funds is greater than the volatility of the returns of fixed-income funds. It is already a universally accepted rule that equities are riskier than fixed-income securities. However, since funds are preferred based on the risk appetite of the investor due to their portfolio structure and therefore the risk they carry, each fund is evaluated in its category. In this way, the volatility (risk) of an equity fund preferred by an investor with a high-risk appetite is not compared to the volatility (risk) of a fixed-income fund preferred by an investor with a low-risk appetite. Example: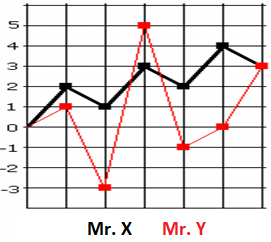 To understand the concept of volatility (standard deviation), let’s look at the example of two traders, Mr. X, and Mr. Y: Mr. X always wins 2 and loses 1, and after 6 trades, he wins a total of 3. In other words, he wins 0.5 per trade ((2 – 1 + 2 – 1 + 2 – 1 + 2 – 1) / 6). On the other hand, Mr. Y wins a total of 3 after 6 trades and his average per trade is 0.5 ((1 – 4 + 8 – 6 +1 + 3) / 6). On the surface, the return performance of both is the same, but the chart above clearly shows that Mr. X’s performance is less risky than Mr. Y’s performance as it is subject to much less volatility. Standard Deviation is used to see this difference. To find the standard deviation of the above styles, we first average the returns per trade, then subtract this average from the returns of each trade. These figures are then squared to eliminate negative values. Finally, the sum of the squares is divided by the number of trades to get the square root of the result.
\text {Standard Deviation}=\sqrt{\frac{\sum\limits_{i=1}^n (x_i-\bar x)}{n}}
To understand the concept of volatility (standard deviation), let’s look at the example of two traders, Mr. X, and Mr. Y: Mr. X always wins 2 and loses 1, and after 6 trades, he wins a total of 3. In other words, he wins 0.5 per trade ((2 – 1 + 2 – 1 + 2 – 1 + 2 – 1) / 6). On the other hand, Mr. Y wins a total of 3 after 6 trades and his average per trade is 0.5 ((1 – 4 + 8 – 6 +1 + 3) / 6). On the surface, the return performance of both is the same, but the chart above clearly shows that Mr. X’s performance is less risky than Mr. Y’s performance as it is subject to much less volatility. Standard Deviation is used to see this difference. To find the standard deviation of the above styles, we first average the returns per trade, then subtract this average from the returns of each trade. These figures are then squared to eliminate negative values. Finally, the sum of the squares is divided by the number of trades to get the square root of the result.
\text {Standard Deviation}=\sqrt{\frac{\sum\limits_{i=1}^n (x_i-\bar x)}{n}}
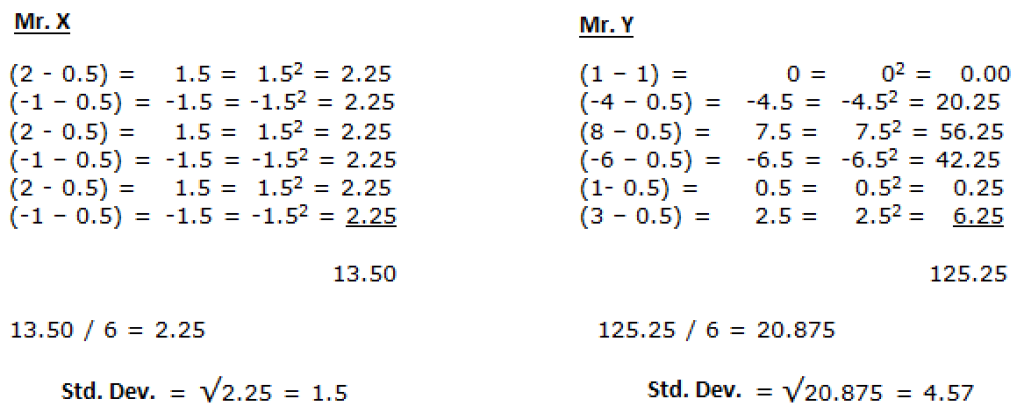 Here, both traders earned 0.5 per trade for a total of 3 wins after 6 trades. However, Mr. X’s consistent performance is not seen in Mr. Y’s. This is because Mr. X’s returns were close to the average for each trade. On the other hand, Mr. Y’s returns fluctuated widely compared to the average. These fluctuations define the risk inherent in performance. The smaller the calculated standard deviation (deviation from the mean), the lower the risk inherent in the performance. If the fluctuations of Mr. Y’s returns had always fluctuated above the mean, he would have had a more desirable performance despite having a high standard deviation. Although Standard Deviation technically measures the fluctuations in a fund’s returns, not the risk inherent in its performance, it is a consistent way of describing the risk inherent in a fund since it evaluates these fluctuations on both the positive and negative sides of the mean and since the tendency for high returns to be accompanied by high risk is the norm.
3. Sharpe Ratio (Risk Adjusted Return)
Volatility is a good measure of risk when comparing two funds in the same category that have achieved the same return. However, to compare funds with different returns and volatilities (risk), one should use a parameter that captures both return and risk in the same pot. Among many different parameters, SAHA prefers to use the Sharpe Ratio to best express the risk-adjusted return. The Sharpe Ratio evaluates risk-adjusted performance by subtracting the risk-free interest rate from gross return and dividing the resulting net return by volatility (standard deviation), a measure of risk. For example, if we assume that the volatility of a fund yielding 15% in an environment where the risk-free interest rate is 10% is 2%; \text {Sharpe Ratio}=\frac{15\%-10\%}{2\%}=2.5 The higher the Sharpe Ratio, the better the risk-adjusted performance. The higher a fund’s risk-adjusted net return (performance) and the lower its volatility, the higher its ratio will be. Since this ratio is not meaningful as a stand-alone number, each fund’s Sharpe Ratio is a measure of relative performance compared to the ratios of its peers in its category.4. Peer Performance (Return Measurement):
The monthly (yearly, 3-year) return of the fund is compared to the monthly (yearly, 3-year) average return of the fund category (class) in which the fund is included. The comparison is based on the percentage of months in which the fund’s return has historically exceeded the average category return. This parameter measures how the fund performs compared to its peers.5. Timing capability measurement:
One of the criteria for measuring fund performance is the extent to which the fund manager can react to changes in market conditions to the extent permitted by the fund’s charter. In response to changes in market conditions, the fund manager will take offensive or defensive measures by increasing/decreasing/adding/subtracting certain asset classes in the fund portfolio to the extent permitted by the fund’s charter. The outcome of these measures is indicative of the fund manager’s timing ability. SAHA assesses timing ability by measuring the extent to which the fund’s return diverges from the return of its category (class). Ideally, the fund return should be a higher positive value during periods when the fund’s category (class) return is positive, and either a positive or a lower negative value during periods when the fund’s category (class) return is negative.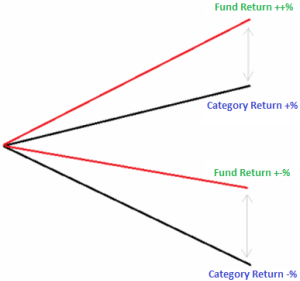
6. Internal Rate of Return (IRR)
This parameter is only used for Pension Funds. The most significant difference between pension funds and other investment funds is the regular payments made to the fund. Therefore, the accumulated savings of the participant at the end of a certain period (i.e. the return on his/her contributions) may be very different from the fund return rates given for the two dates as above. For investors to understand this difference, it would be more accurate to use the Internal Rate of Return, which is the discount rate that equates the present net value of a series of future cash flows to zero. If your cost of capital or desired minimum rate of return is less than the internal rate of return, the investment is no longer attractive. The Internal Rate of Return, which equates the net present value of future cash flows to zero, is calculated as follows: 0=NPV=\sum\limits_{i=1}^T \frac {C_t}{(1+IRR)^t}-C_0 where,C_t=\text{Net cash inflow during the period}\ t
C_0=\text{Total initial investment costs}
IRR=\text{The internal rate of return}
t=\text{Number of time periods}
Example: An investor investing TL 1,000,000 earns a return of TL 330,000 at the end of year 1, TL 365,000 at the end of year 2, and TL 435,000 at the end of year 3. The internal rate of return on this investment is 6.10%.
\text {1,000,000}= \frac{\text{330,000}}{(1+İVO)^1}+\frac{\text{365,000}}{(1+İVO)^2}+\frac{\text{435,000}}{(1+İVO)^3} \ \ \text{\;} \ \ İVO=\text {0,061} Pension Funds are rated every month just like Mutual Funds. In addition to the 6 parameters used in the Mutual Funds rating methodology, the Internal Rate of Return is used as the seventh parameter. The Internal Rate of Return of the fund for the past 1 year is taken into account in each month’s rating.How is the Fund’s Final Rating Determined?
Each fund is rated within its class (category). SAHA weights the 5 criteria listed above for mutual funds and 6 criteria for pension funds according to its proprietary methodology to determine the final grade. After the final grade is determined, five (5) stars are allocated to the top 10% of the fund class (category), four (4) stars to the next 22.5%, three (3) stars to the next 35%, two (2) stars to the next 22.5% and one (1) star to the last 10%.